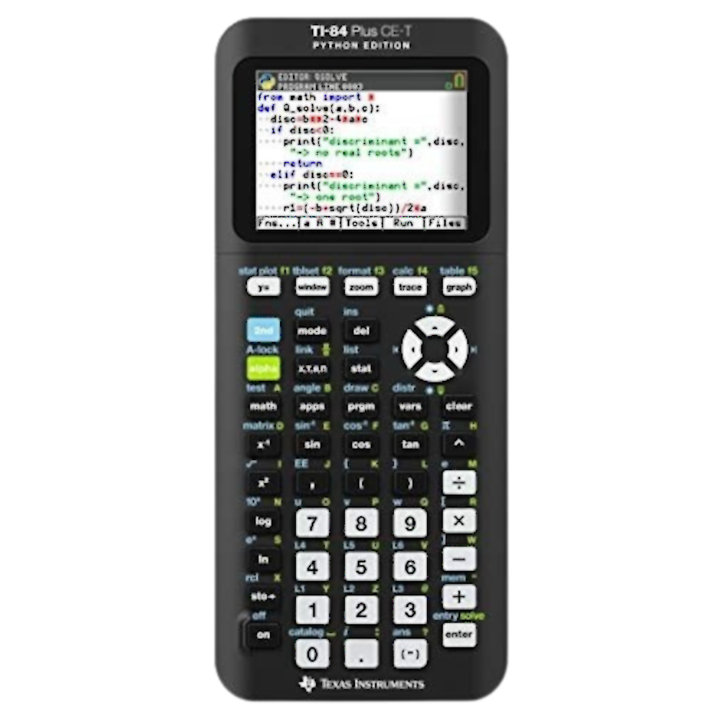
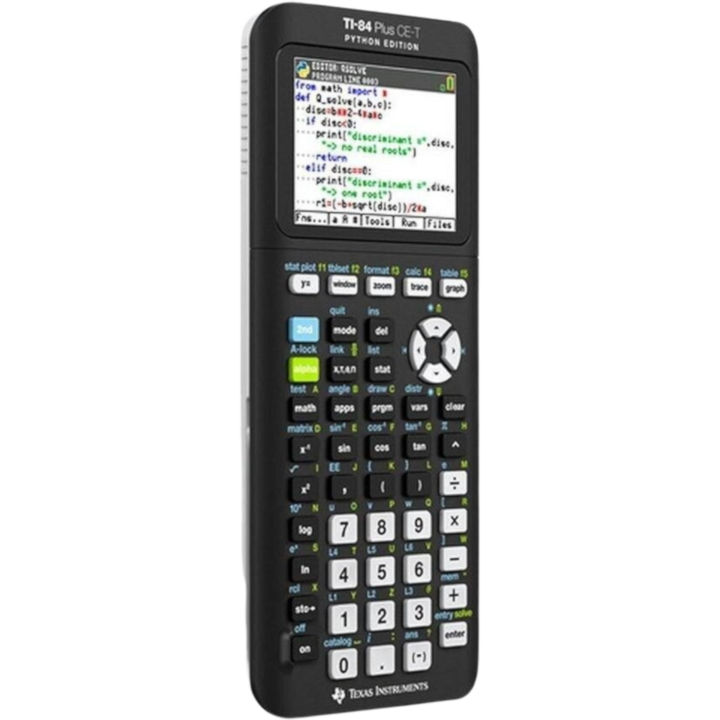
TI-84 Plus CE-T Python Graphing Calculator

BNT171634

Main features:
High-resolution color screen that is backlit

Read more
From external warehouse
1604,00SEK
No VAT added
Amount 1/Each

Product Information

  • Main features:
    High-resolution color screen that is backlit

    Rechargeable TI battery

    Familiar features from TI-84 Plus

    Import and use images

    Test mode function

    The programming language Python is integrated (Python is only available in this model and will also be integrated into TI-Nspire™ CX by the turn of the year 20/21)

    APPROVED FOR EXAMS

    Optimal color screen
    Visualize concepts clearly and create faster and stronger connections between equations, data, and graphs in color.

    Better readability thanks to the improved backlit screen

    Color makes it easier to distinguish between different graphs, plots, and objects

    Grid in graphs provides greater clarity and easier reading

    Built-in features
    Ability to add images as a background to a graph

    15 colors for displaying different graphs

    Change style and color of axes and grids in graphs

    Catalog for syntax help

    An alphabetical catalog of all the graphing calculators functions is available in a menu

    Advanced functions are accessed via drop-down menus

    Real and complex calculation results are computed with 14-digit accuracy and displayed with 10 digits and a 2-digit exponent

    Plots 10 functions, 6 curves in parametric form, 6 curves in polar form, and 3 recursively defined sequences

    Up to 10 functions can be defined, saved, plotted, and analyzed simultaneously

    In the sequence graph mode, the sequence can be displayed as a time graph or as a phase diagram.

    User-defined list names. Up to 999 elements can be stored in lists

    17 interactive zoom functions

    Numerical evaluations are displayed in table format for all graph modes

    Interactive analysis of function values, roots, maxima, minima, integrals, and derivatives

    8 different graph styles make it easy to distinguish between the various graphs plotted simultaneously

    The screen display can be split horizontally or vertically

    Display graphs and tables side by side.

    Stores up to 10 items

    Matrix functions include inverses, determinants, transposition, augmented matrix, reduced row echelon form, and elementary row operations. Matrices can be converted to lists and vice versa

    List-based one- and two-variable analysis. Logistic, sinusoidal, median-median, linear, logarithmic, exponential, power, quadratic, cubic, and quartic regression models

    3 statistical definitions for scatter plots, xy-plots, histograms, regular and modified box plots, and normal distribution plots

    Advanced statistical functions including 10 functions for hypothesis testing, 7 functions for confidence intervals, and one-way analysis of variance (ANOVA)

    15 functions for probability distribution, including normal, Students t, chi-square, binomial, and Poisson

    Financial functions such as time value of money (TVM), cash flows, and amortization. Interactive full-screen editor for solving TVM problems

    Interactive editor for equation solving allows for numerical solutions of various variables in an equation

    11 regression model calculations


    @@aipolicy

Attributes

Specifications

Packaging per pallet (pc) 9998
Quantity per pack (pcs) 1 PCS/CASE
Quantity per salesunit 1
EAN 3243480105101

Get the latest updates from Tingstad!

Offers
Inspiration
Information

We can help you!

Visiting Address:

Marieholmsgatan 1, 415 02 Gothenburg

Post Address:

Box 13013, 402 51 Gothenburg

Quick links

Information